Aging and Living Arrangements
 By 2030, the Baby Boomers will all be 65 years old or older, contributing to the growing aging population both in Kentucky and the nation as a whole. Between 2017-2022, an estimated 540,893 (+/- 2,877) households in Kentucky had one or more persons ages 65 and over (2022 American Community Survey 5-year estimate). While some older adults require nursing home care and other long-term care services, today’s older adults are healthier overall and will live independently for longer. Today, the majority of older adults in Kentucky live at home either on their own or with family members including spouses, adult children, and extended family.
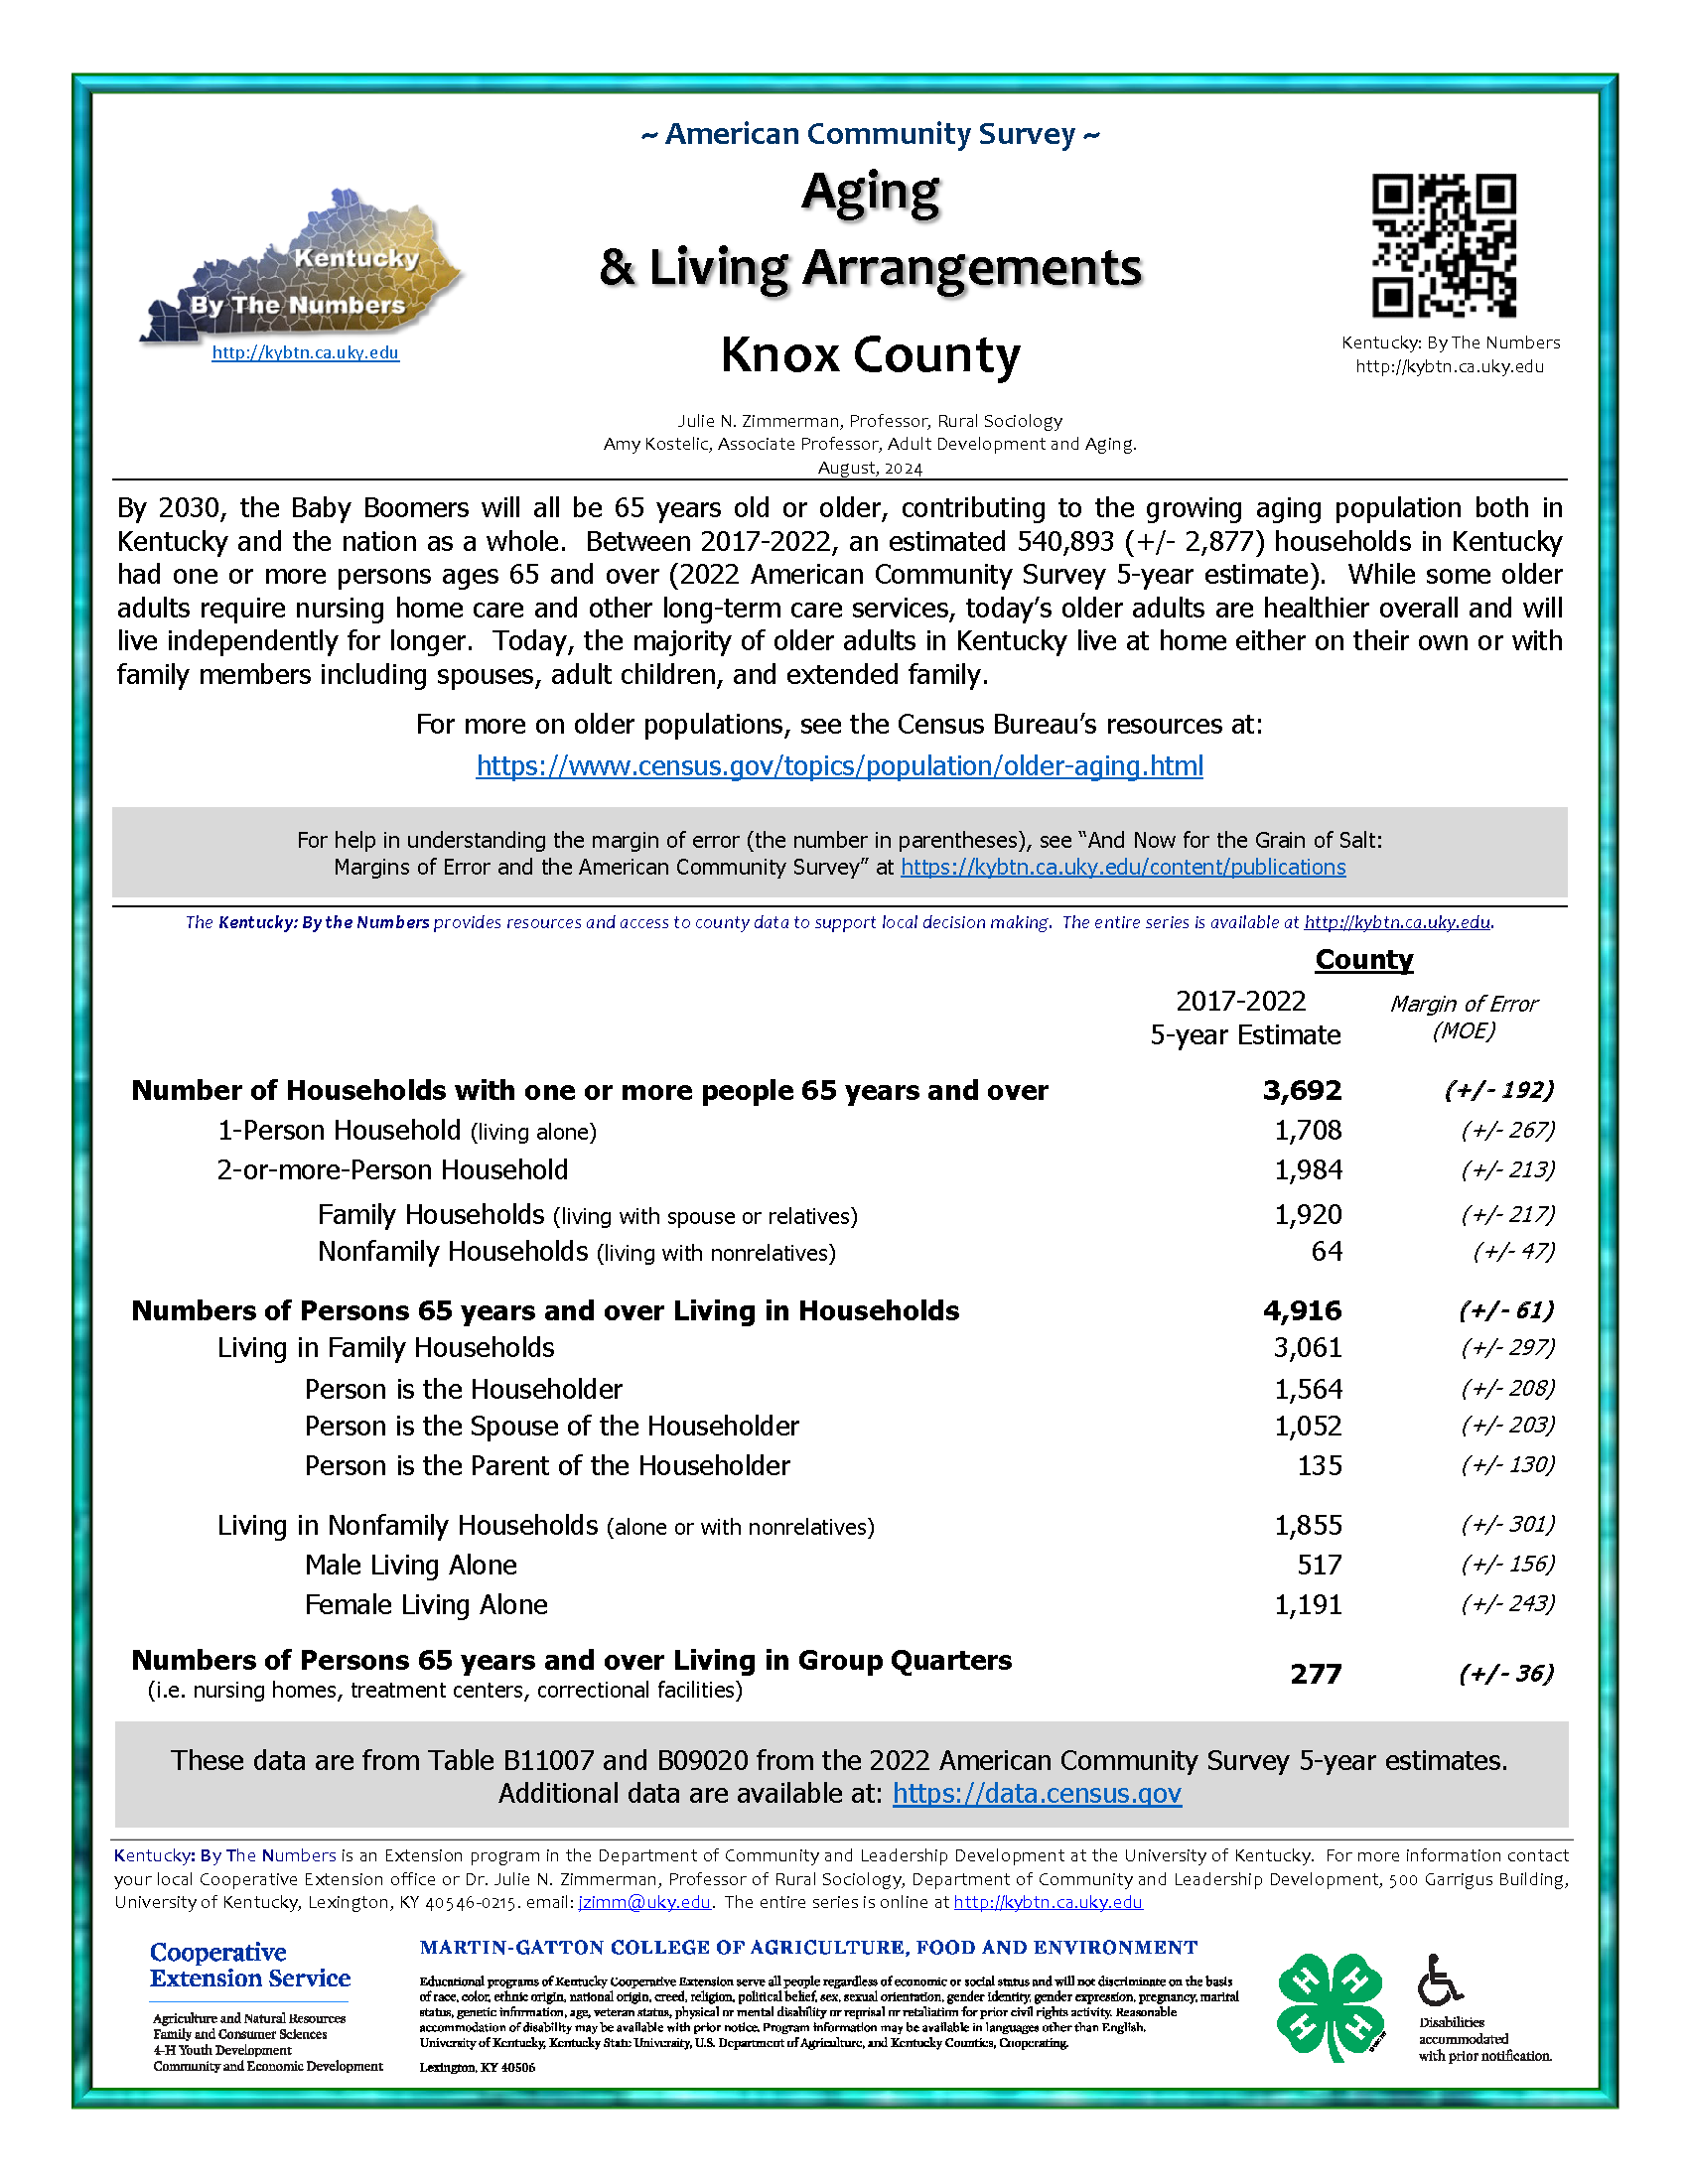
For help in understanding the margin of error (the number in parentheses), see
“And Now for the Grain of Salt: Margins of Error and the American Community Survey” at
https://kybtn.ca.uky.edu/content/publications
County Data Sheets
To find your county...click on the file that contains your county name. All counties are listed alphabetically.
To print your county...scroll down to it and print the current page(s) only.
~ ~ Each Data Sheet is 1 Page Long ~ ~
EACH OF THE FILES CONTAINS 20 COUNTIES.
To view these files, you will need Adobe Acrobat
Adair County through Carlisle County
Carroll County through Garrard County
Grant County through Knott County
Knox County through Martin County
Mason County through Pulaski County
Robertson County through Woodford County
Data Source
These data are from Table B11007 and B09020 from the 2022 American Community Survey 5-year estimates.
Additional data are available at: https://data.census.gov
