Youth Race and Ethnicity Over Time
To help in understanding diversity in our communities and provide easy access to data, a multi-part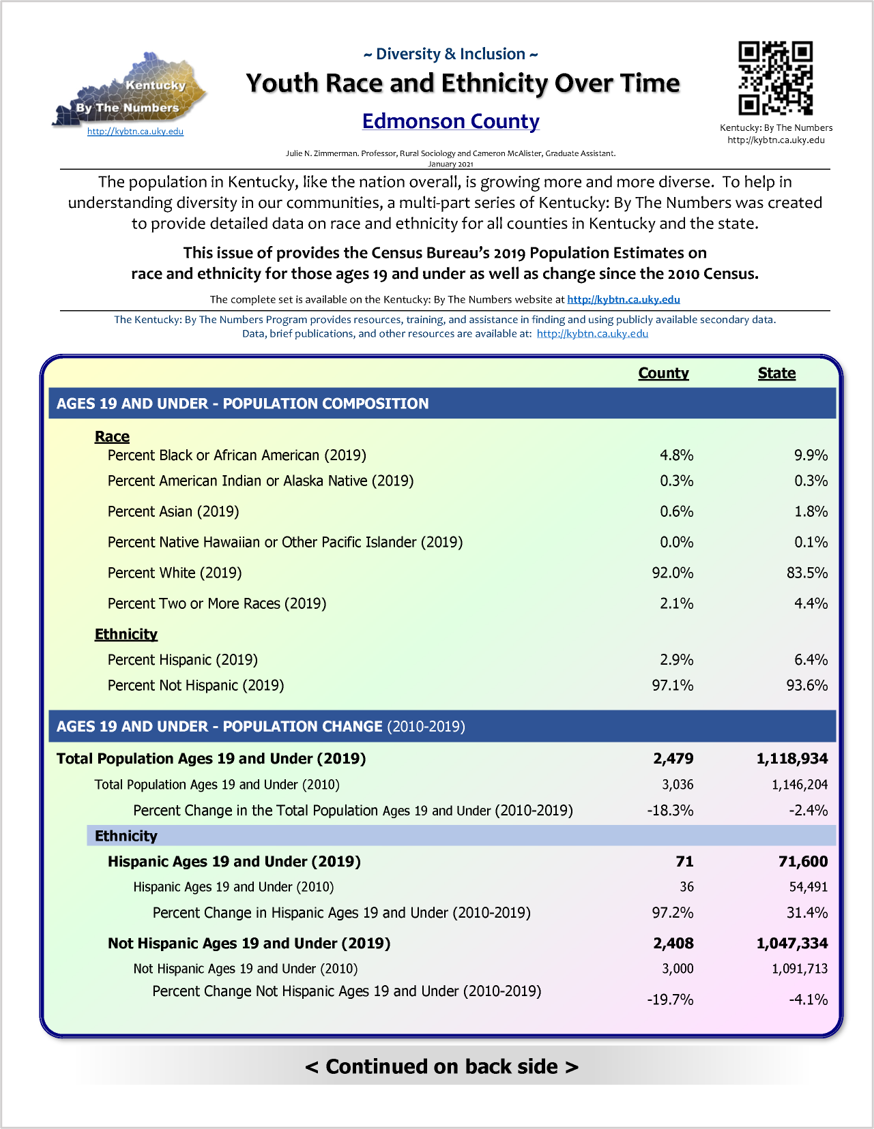 series of Kentucky: By The Numbers was created to provide detailed data on race and ethnicity for counties in Kentucky and the state.
Since youth are the most diverse age group, this issue provides each county with data from the 2019 population estimates, the population composition of youth ages 19 and under (ie. % Black or African American), and the percent change since the 2010 Census.
To see the fill list of issues in this series, click HERE
County Data Sheets
To find your county, click on the file that contains your county name. All counties are listed alphabetically.
To print your county, scroll down to it and print the current page(s).
~ ~ Each Data Sheet is 2 Pages Long ~ ~
EACH OF THE FILES CONTAINS 10 COUNTIES.
To view these files, you will need Adobe Acrobat.
Adair County through Boyd County
Boyle County through Carlisle County
Carroll County through Daviess County
Edmonson County through Garrard County
Grant County through Hart County
Henderson County through Knott County
Knox County through Livingston County
Logan County through Martin County
Mason County through Nelson County
Nicholas County through Pulaski County
Robertson County through Todd County
Trigg County through Woodford County
Data Source
These data are from the Census Bureau's Population Estimate Program https://www.census.gov/data/tables/time-series/demo/popest/2010s-countie...
Additional Population Estimates are available at the Kentucky State Data Center
http://ksdc.louisville.edu/
